User Guide: Clinical ECG Paper Plotting
The ecg_sdk.visualization module renders electrocardiogram traces on digital millimeter grid paper matching international clinical standards (IEC 60601-2-25, AHA, ACC, ESC).
Physical Clinical Paper Standards
In clinical practice, ECG paper follows strict mechanical and electrical calibration standards:
| Standard Parameter | Nominal Metric Value | Imperial Value | Clinical Representation |
|---|---|---|---|
| Paper Speed | \(25.0\text{ mm/s}\) | \(0.984\text{ in/s}\) | Minor grid (\(1\text{ mm}\)) = \(0.04\text{ s} = 40\text{ ms}\) Major block (\(5\text{ mm}\)) = \(0.20\text{ s} = 200\text{ ms}\) |
| Voltage Gain | \(10.0\text{ mm/mV}\) | \(0.394\text{ in/mV}\) | Minor grid (\(1\text{ mm}\)) = \(0.10\text{ mV}\) Major block (\(5\text{ mm}\)) = \(0.50\text{ mV}\) |
| Calibration Pulse | \(1.0\text{ mV} \times 0.20\text{ s}\) | \(10\text{ mm} \times 5\text{ mm}\) | \(1.0\text{ mV}\) vertical step with \(200\text{ ms}\) width |
| 12-Lead Diagnostic Sheet | \(279.4 \times 215.9\text{ mm}\) | \(11.0'' \times 8.5''\) | US Letter Landscape (or \(297 \times 210\text{ mm}\) for ISO A4) |
| Ambulatory Thermal Roll | \(50.0\text{ mm}\) channel | \(\approx 2.0''\) height | Standard Holter / telemetry continuous roll |
Sparse Tick Labeling (sparse_ticks, time_tick_step, voltage_tick_step)
On clinical paper, drawing numbers at every major grid line (\(0.2\text{ s}\) and \(0.5\text{ mV}\)) creates visual clutter.
By default, sparse_ticks=True separates the millimeter grid lines from the numerical axis labels:
- Time axis labels: Rendered cleanly at integer seconds (\(0, 1, 2, 3, \dots\text{s}\)) or every time_tick_step=1.0 seconds.
- Voltage axis labels: Rendered at clean half-millivolt or one-millivolt intervals (\(-1.0, -0.5, 0.0, 0.5, 1.0, \dots\text{mV}\)) via voltage_tick_step=0.5.
- Full Millimeter Grid Retained: All \(1\text{ mm}\) (\(0.04\text{ s} / 0.1\text{ mV}\)) and \(5\text{ mm}\) (\(0.20\text{ s} / 0.5\text{ mV}\)) grid lines remain \(100\%\) visible.
from ecg_sdk import load_ecg

# Load MIT-BIH Record 101 (clean textbook sinus rhythm in physical mV)
sig_101 = load_ecg("physionet:mitdb/101", duration=6.0, target_fs=250.0)

# Clean sparse labels every 1.0 second on X, and every 0.5 mV on Y
fig, ax = sig_101.plot_clinical(
    lead="MLII",
    display_mode="paper",
    sparse_ticks=True,
    time_tick_step=1.0,      # Numeric labels at 0s, 1s, 2s, 3s, 4s, 5s, 6s
    voltage_tick_step=0.5,   # Numeric labels at -0.5mV, 0.0mV, 0.5mV, 1.0mV, 1.5mV
)
Recommended Benchmark Records for Paper Mode
When plotting on clinical millimeter paper, records with physical millivolt units (without Z-score normalization) fit naturally within standard medical paper limits (\(\pm 1.5\text{ mV}\)):
| PhysioNet Record | Database | Native \(f_s\) | Rhythm Type | Typical Physical \(V_{\text{peak}}\) |
|---|---|---|---|---|
mitdb/101 |
MIT-BIH | \(360\text{ Hz}\) | Normal Sinus Rhythm (Textbook QRS) | \(+1.4\text{ mV}\) (Lead MLII) |
mitdb/103 |
MIT-BIH | \(360\text{ Hz}\) | Normal Sinus Rhythm (Prominent P, T waves) | \(+1.9\text{ mV}\) (Lead MLII) |
mitdb/119 |
MIT-BIH | \(360\text{ Hz}\) | Ventricular Bigeminy (Frequent PVCs) | \(+2.0\text{ mV}\) (Lead MLII) |
incartdb/I01 |
INCART | \(257\text{ Hz}\) | 12-Lead Clinical Arrhythmia | \(+1.8\text{ mV}\) (Lead II) |
[!TIP] Physical mV vs Z-Score Standardization: Z-score standardization transforms the signal to unit variance (\(\sigma=1\)). Since the ECG is mostly flat baseline with a low standard deviation, the R-peak in Z-score units can reach \(8-10\sigma\). When plotting on clinical paper (\(10\text{ mm/mV}\)), load the record with
normalize=None(ornormalize="robust") to maintain true physical millivolt scale.
Physical 1:1 Scale ("paper") vs Screen ("digital") Modes
The plotting engine provides two display modes via the display_mode parameter:
1. Paper Mode (display_mode="paper" — Default)
- 100% True 1:1 Physical Metric Scale: When exported to high-resolution PDF or printed on paper, a standard physical ruler placed on the printout will measure exactly \(1\text{ mm}\) per small square and \(25\text{ mm}\) per second.
- 12-Lead Full Page: Automatically formats to standard medical sheets:
paper_size="letter": \(11.0'' \times 8.5''\) (US Letter landscape)paper_size="a4": \(11.69'' \times 8.27''\) (ISO A4 landscape)- Rhythm Strips: Formatted to standard thermal roll width (\(50\text{ mm} \approx 2.0''\) height per channel).
from ecg_sdk import load_ecg

# Ingest MIT-BIH 101 with sampling rate standardized to 250 Hz
sig = load_ecg("physionet:mitdb/101", duration=10.0, target_fs=250.0, load_annotations=True)

# 1. Standard 10-second thermal paper rhythm roll (250 mm x 50 mm)
fig, ax = sig.plot_clinical(
    lead="MLII",
    display_mode="paper",
    r_peaks=sig.metadata["annotations"]["r_peaks"],
)

# 2. Standard 12-lead full page report (US Letter landscape 11.0" x 8.5")
from ecg_sdk import plot_12lead_clinical, generate_synthetic_ecg
canonical_12 = ["I", "II", "III", "aVR", "aVL", "aVF", "V1", "V2", "V3", "V4", "V5", "V6"]
sig_12 = generate_synthetic_ecg(duration=10.0, sampling_rate=250.0, lead_names=canonical_12)
fig12, _ = plot_12lead_clinical(sig_12, display_mode="paper", paper_size="letter")
2. Digital Responsive Mode (display_mode="digital")
- Optimized for Computer Monitors & Slides: Uses an expanded aspect ratio (\(18'' \times 10''\) for 12-lead, \(3.2''\) height per lead track) with enlarged typography and generous vertical headroom, ideal for Jupyter Notebook exploration, web applications, and presentations.
Plot Height & Dimension Customization
You can override defaults at any time using explicit dimension parameters:
plot_height: Total figure height in inches (e.g.plot_height=3.5).height_per_lead: Explicit height per lead track in stacked multi-lead strips.voltage_range(orylim): Fixes the vertical millivolt window (e.g.voltage_range=(-1.5, 2.5)).show_header: Set toFalseto omit the top medical banner for compact UI cards.
Color Palettes & Styles Gallery
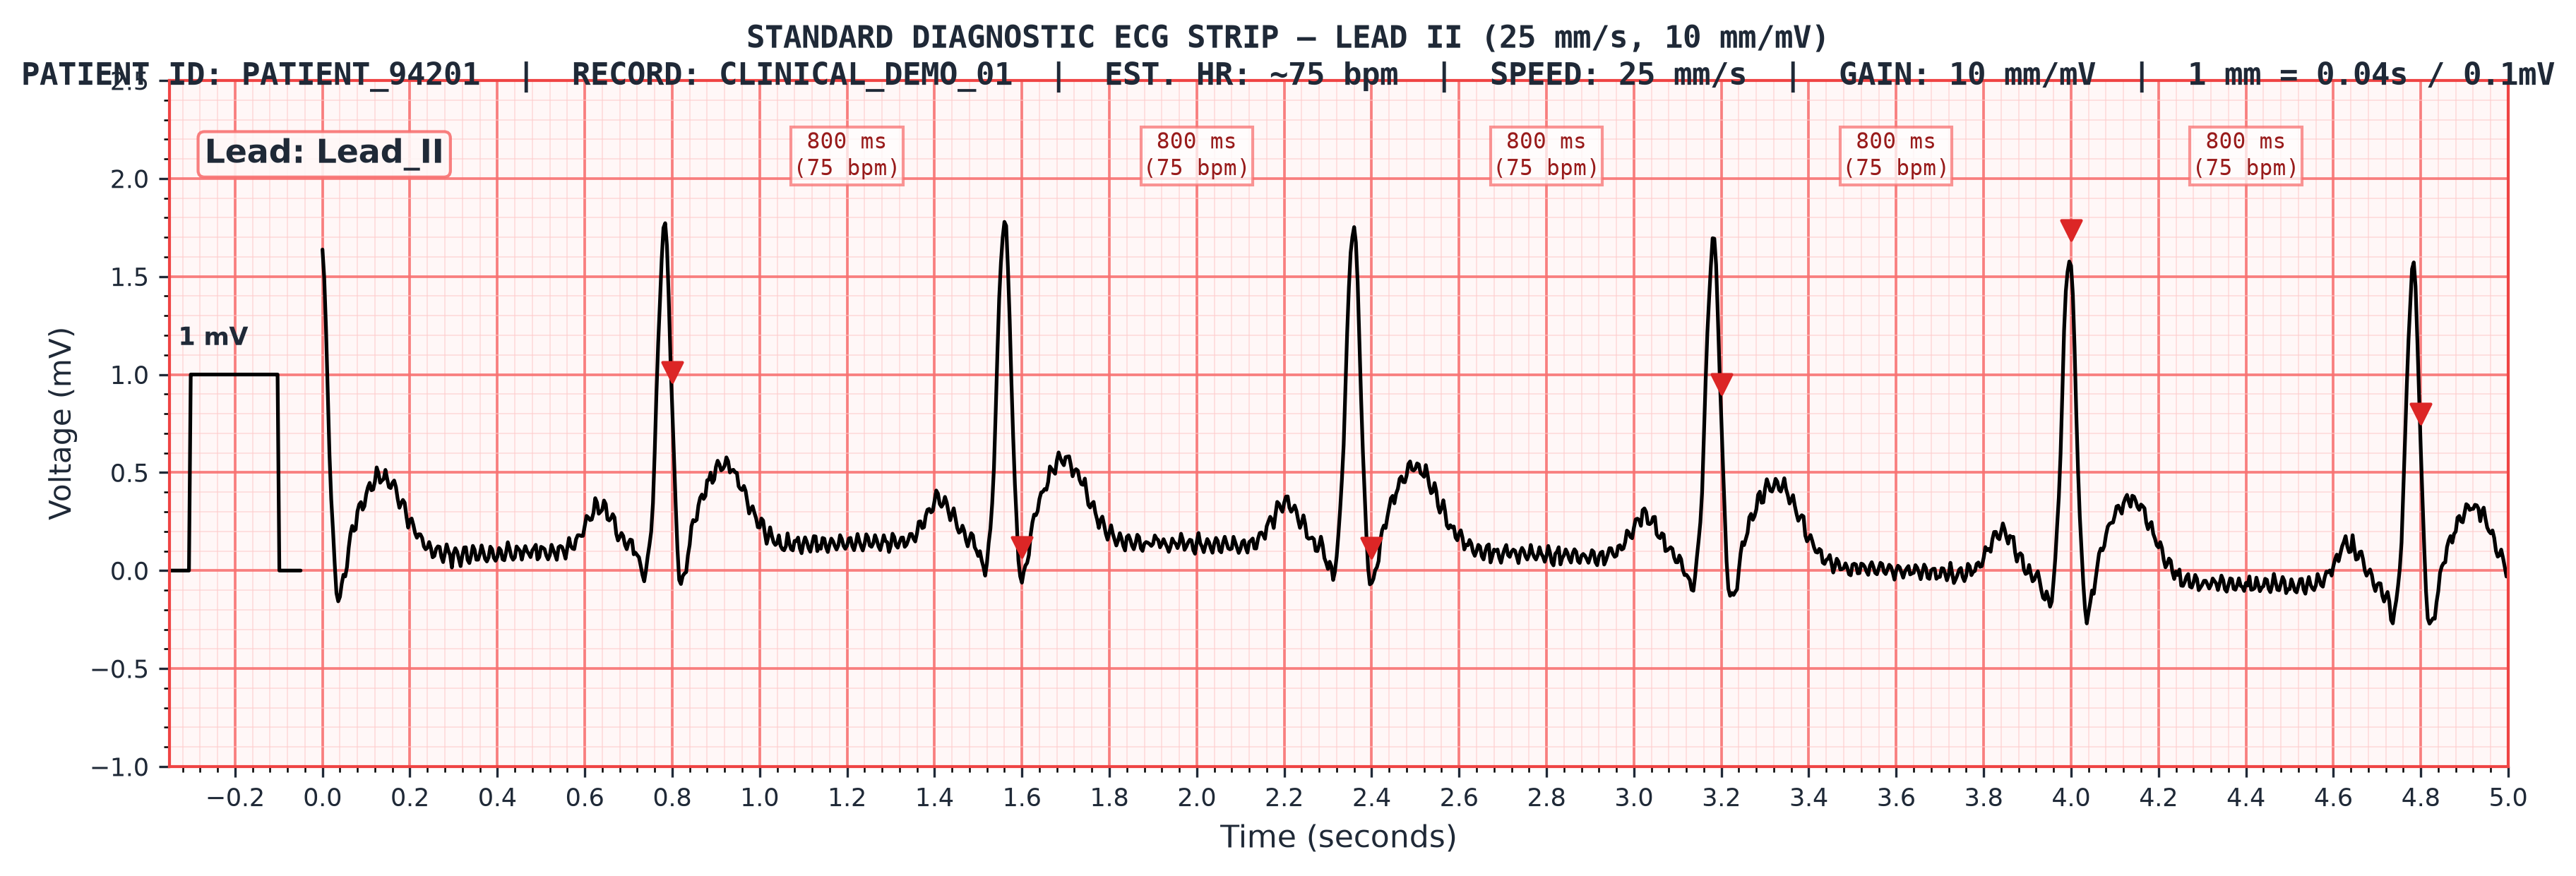
1. Classic Clinical Pink (grid_style="clinical_pink")
Traditional pink/salmon medical millimeter grid with inverted red triangle R-peak markers and calculated instantaneous RR intervals:
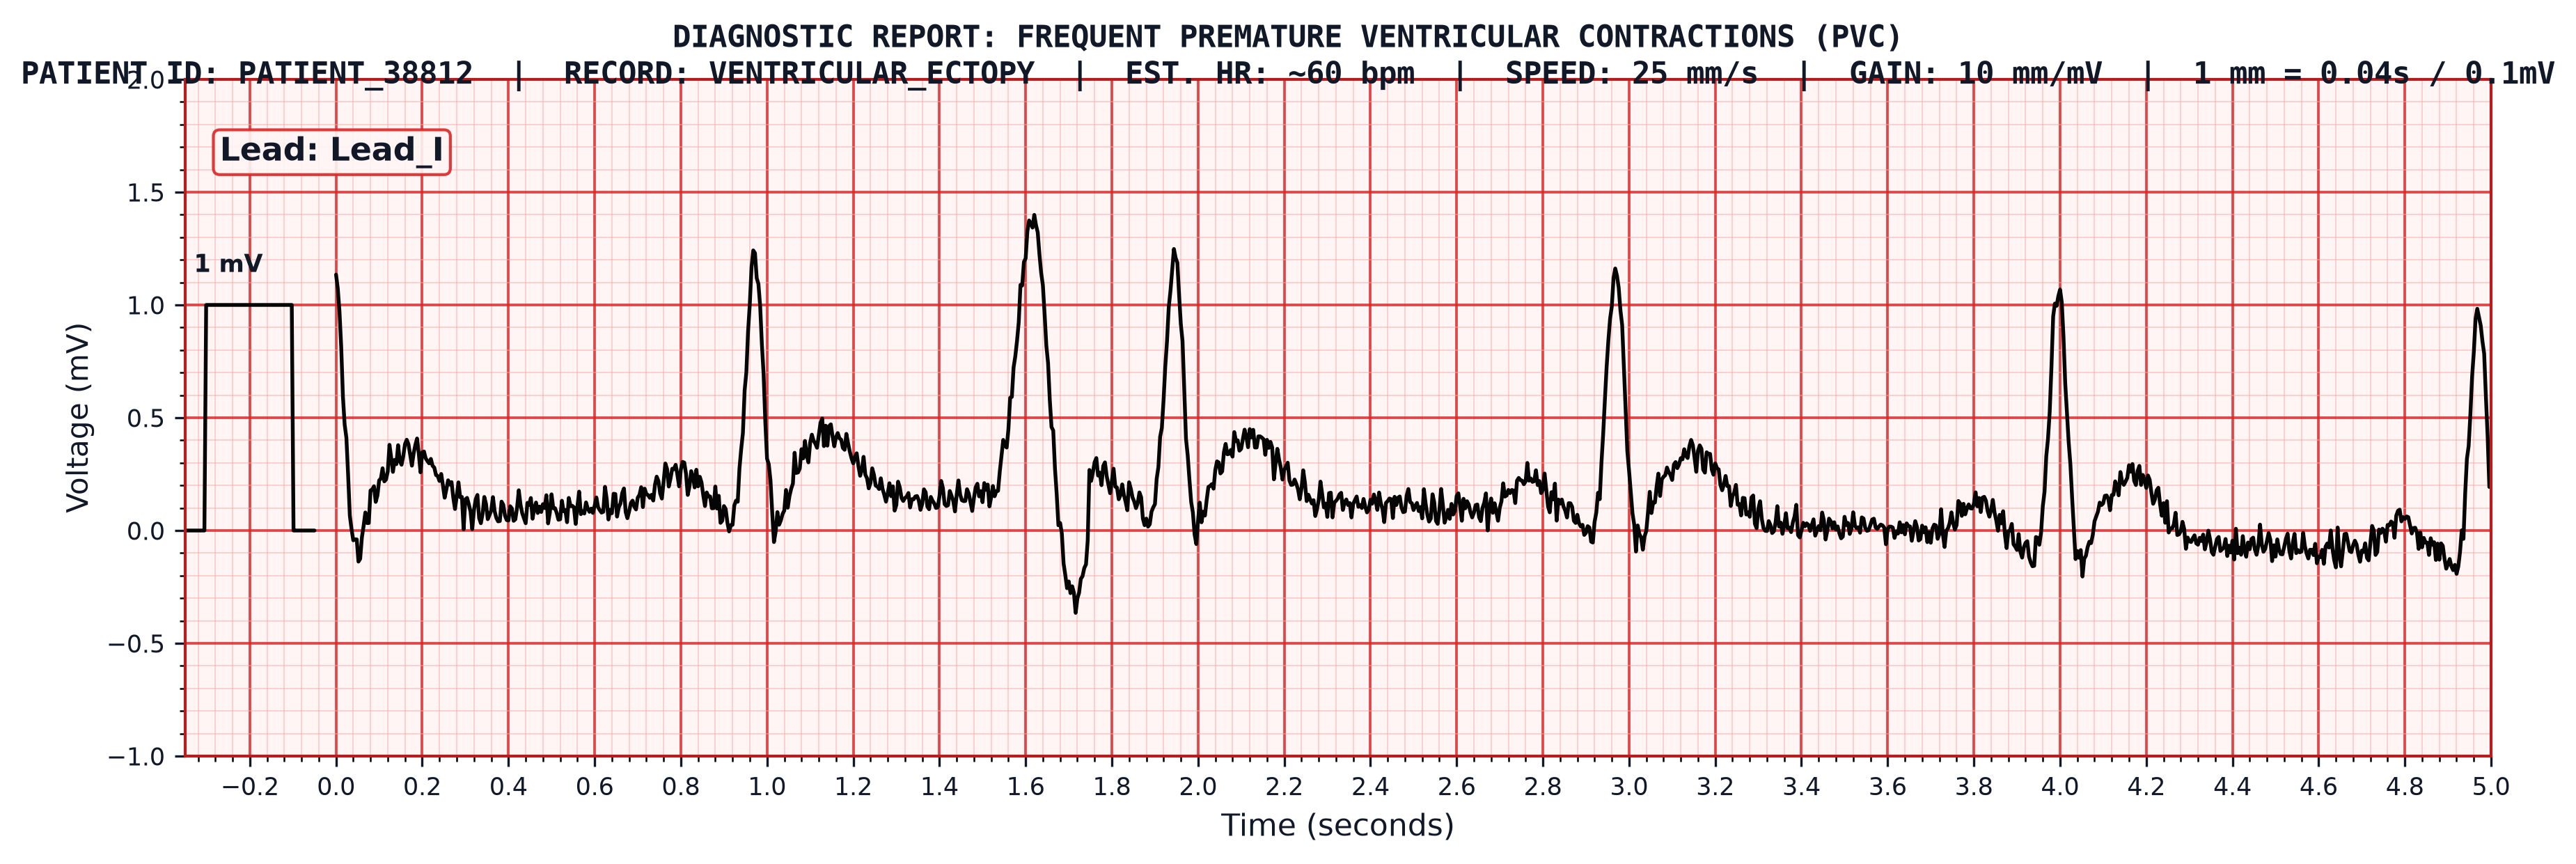
2. High-Urgency Clinical Red (grid_style="clinical_red")
Bold red clinical paper format for urgent pathology alerts and ventricular ectopy (PVCs):
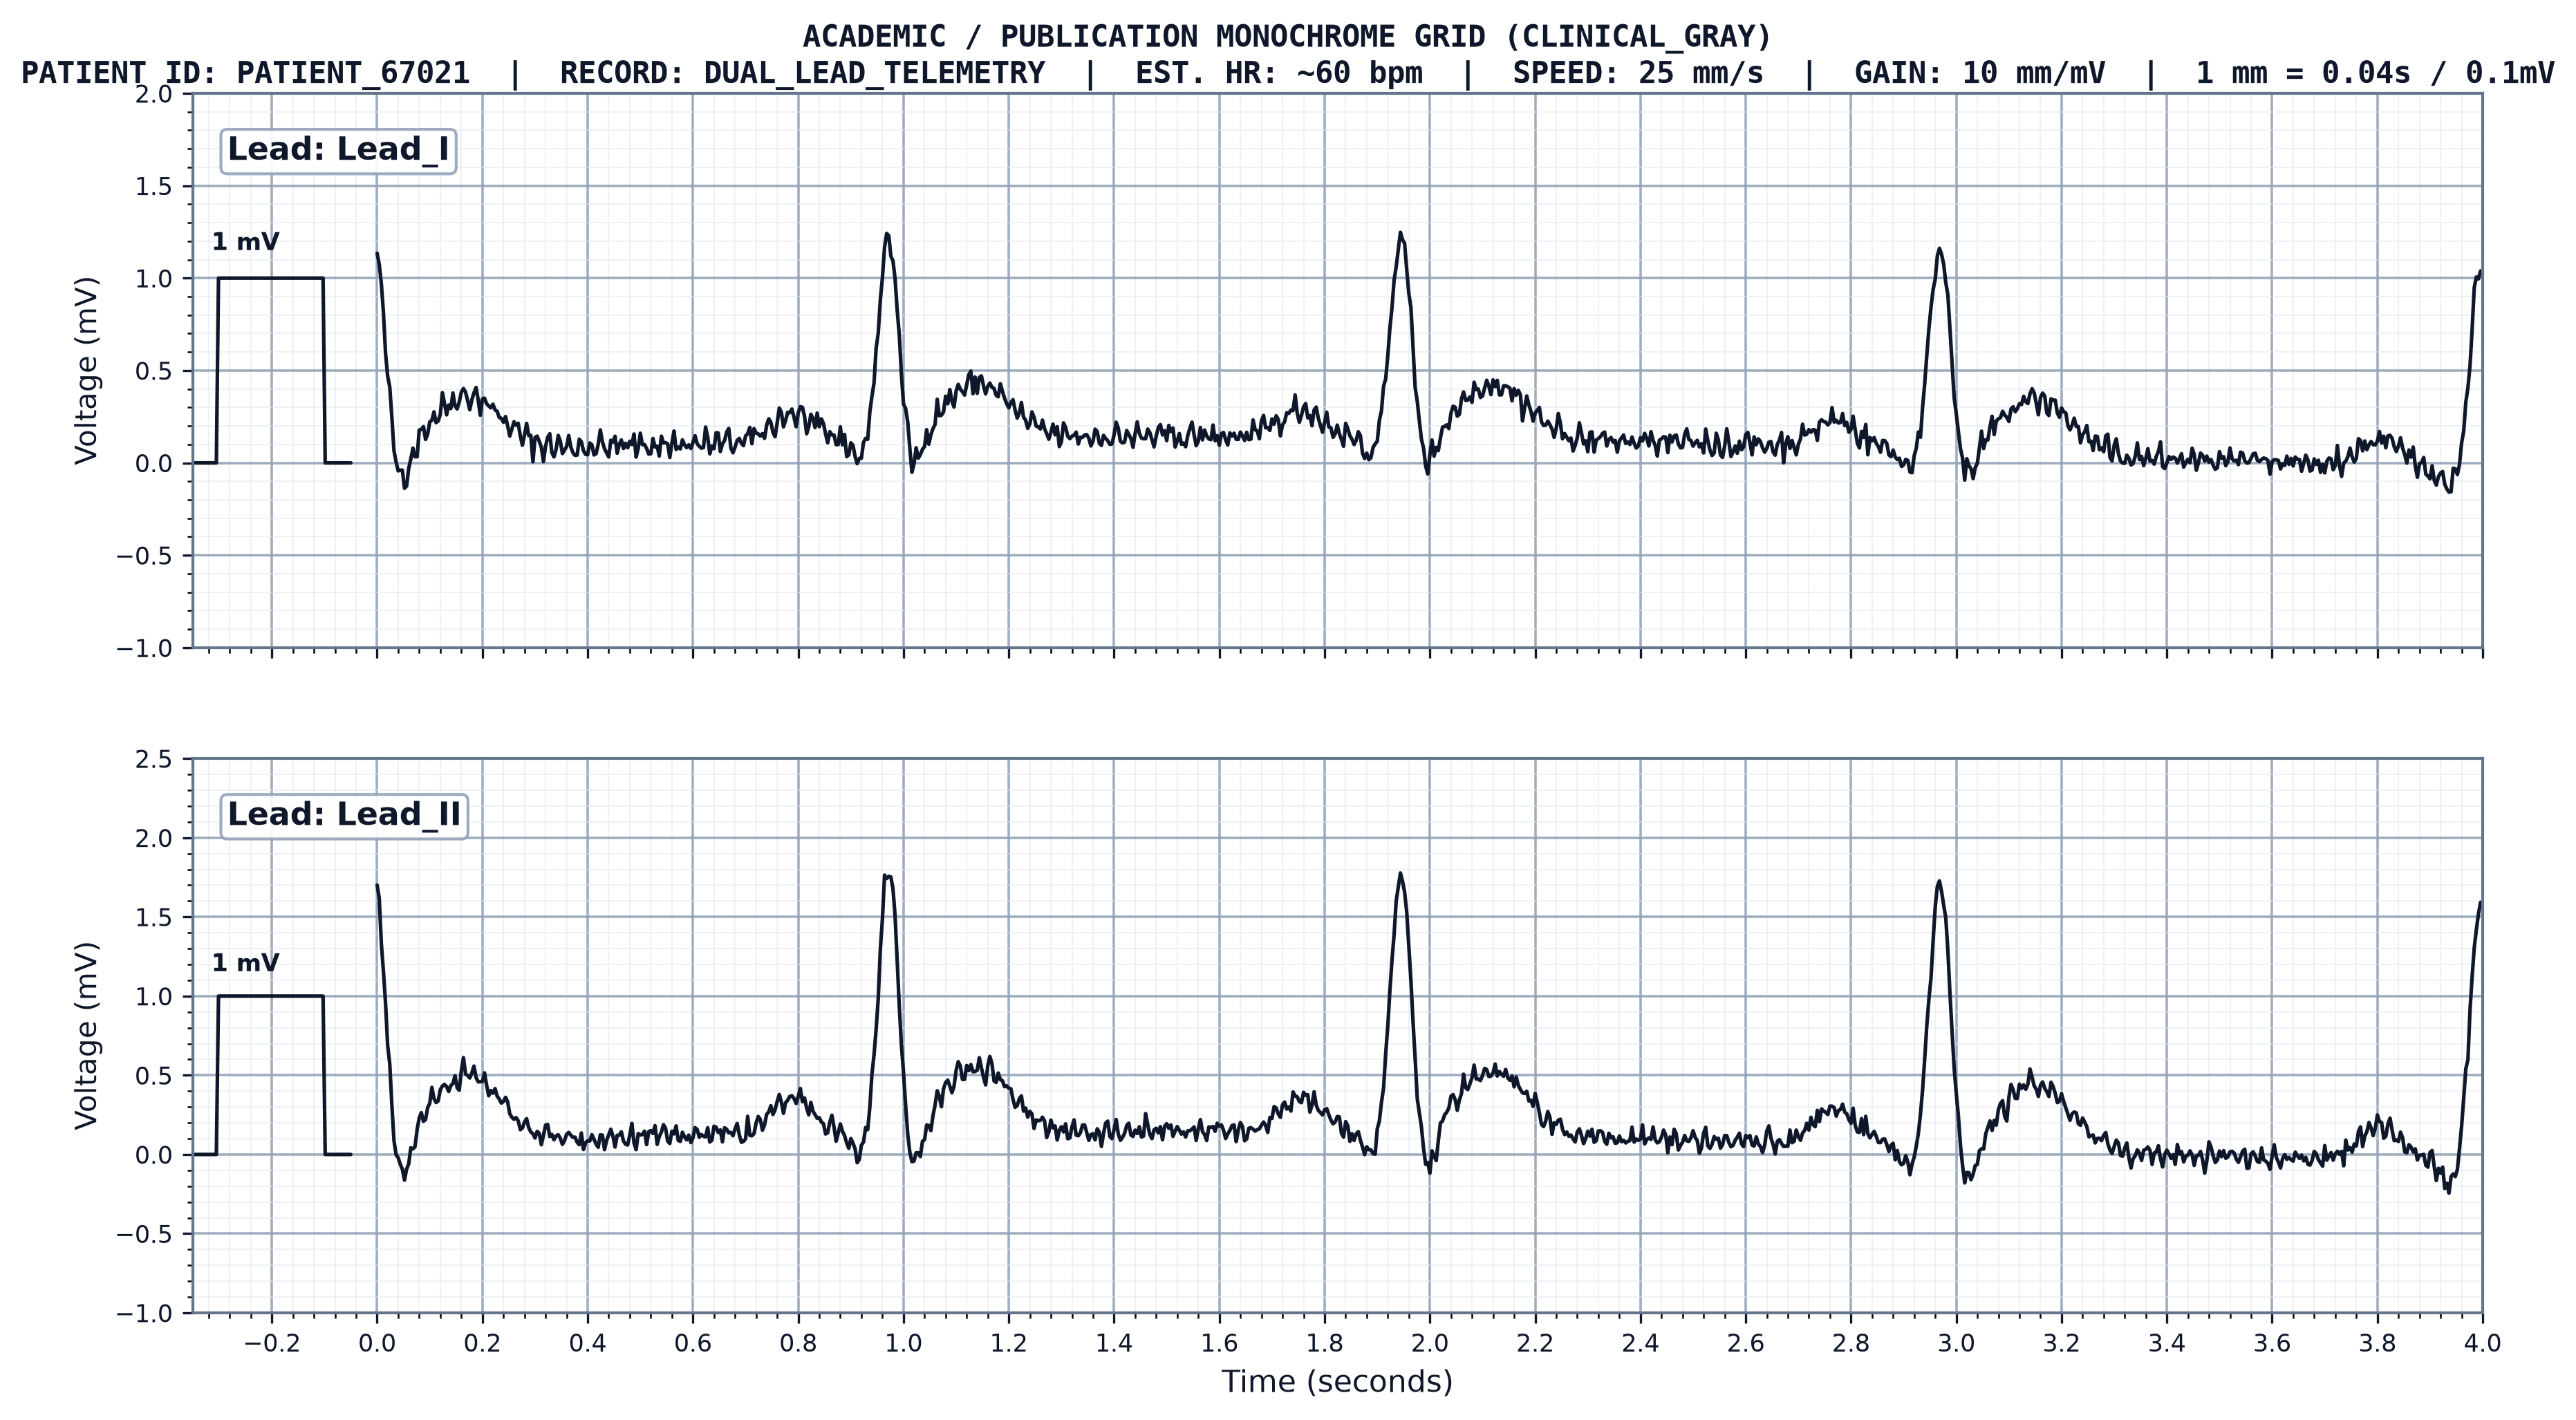
3. Academic Monochrome / Clinical Gray (grid_style="clinical_gray")
Publication-ready clean grayscale millimeter grid for scientific journals and thesis figures:
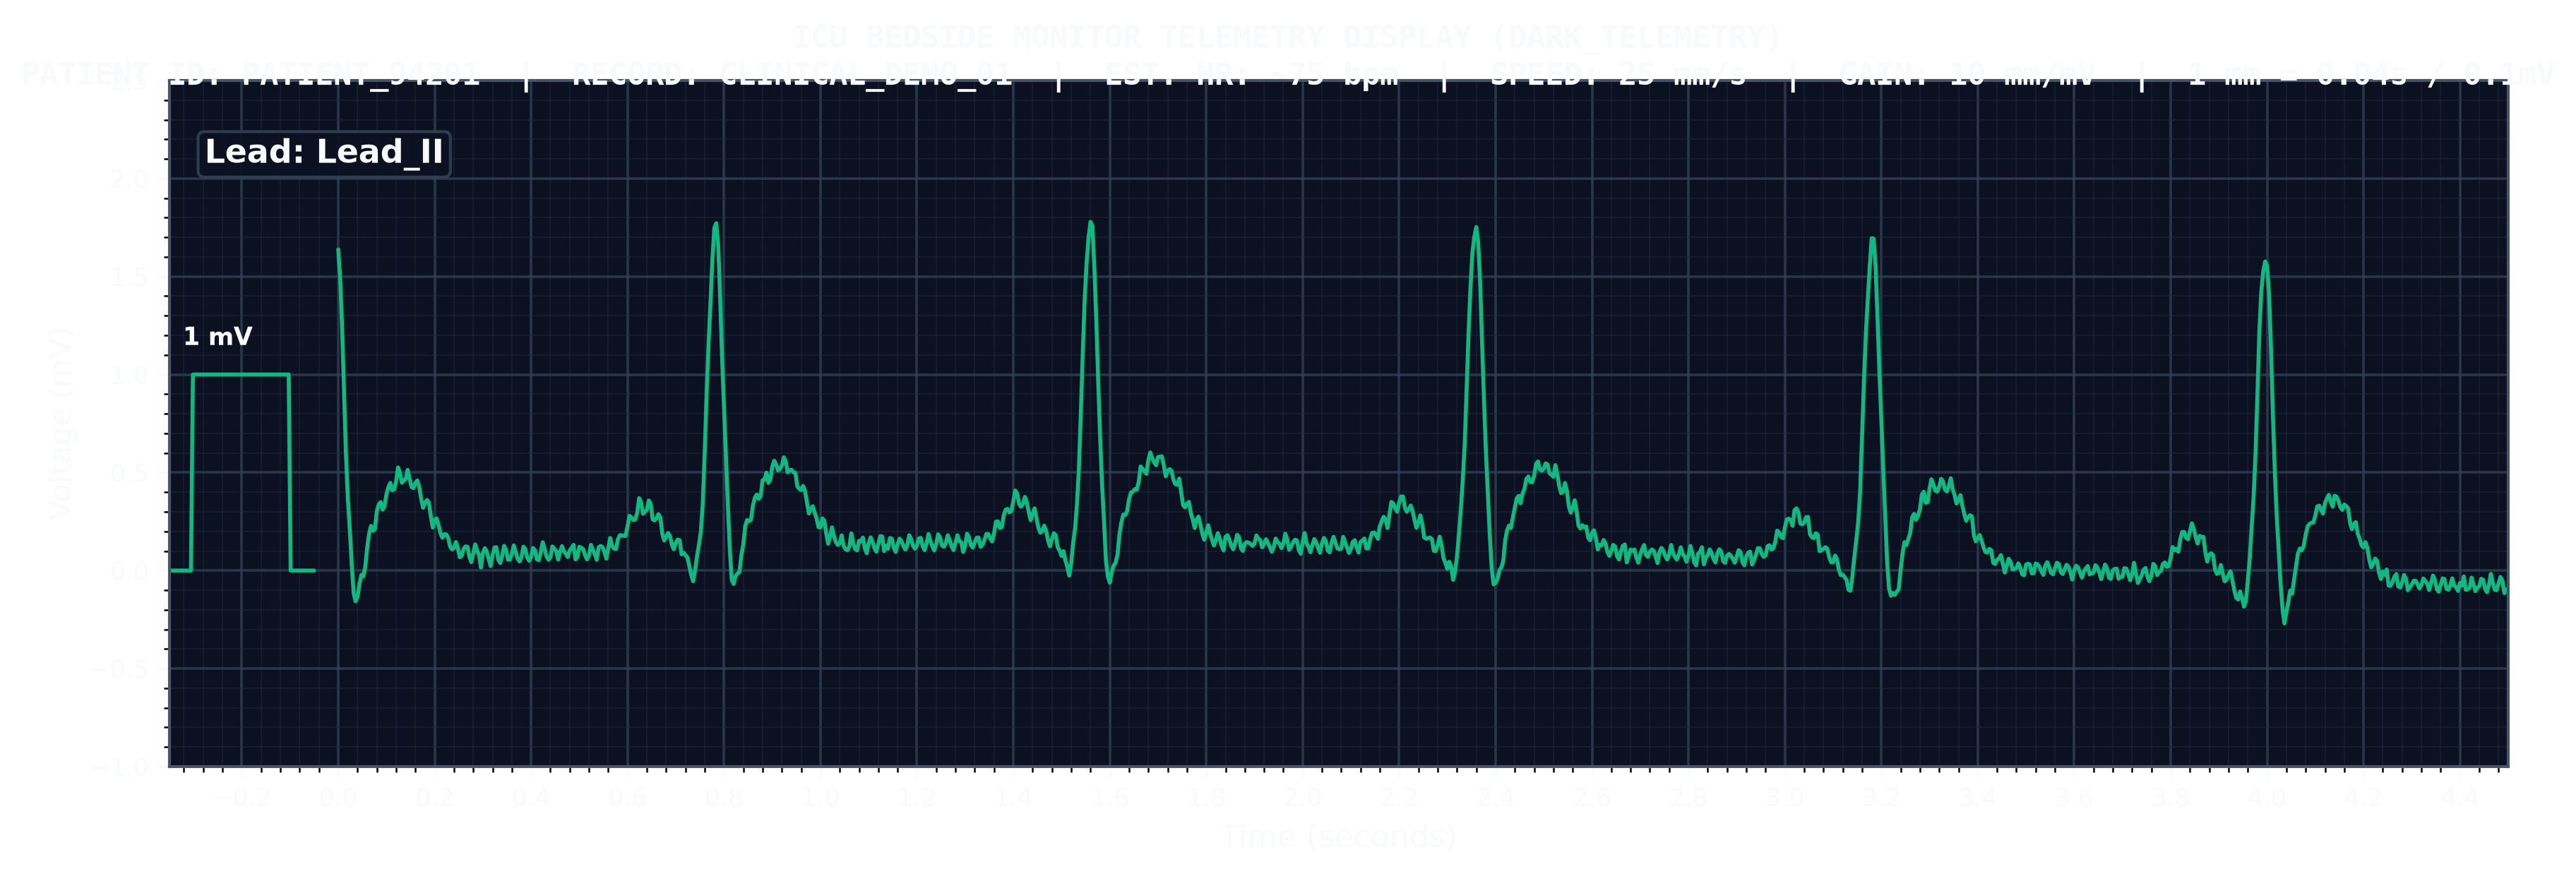
4. ICU Dark Telemetry (grid_style="dark_telemetry")
High-contrast dark-mode telemetry display matching hospital bedside monitors and smartwatches:
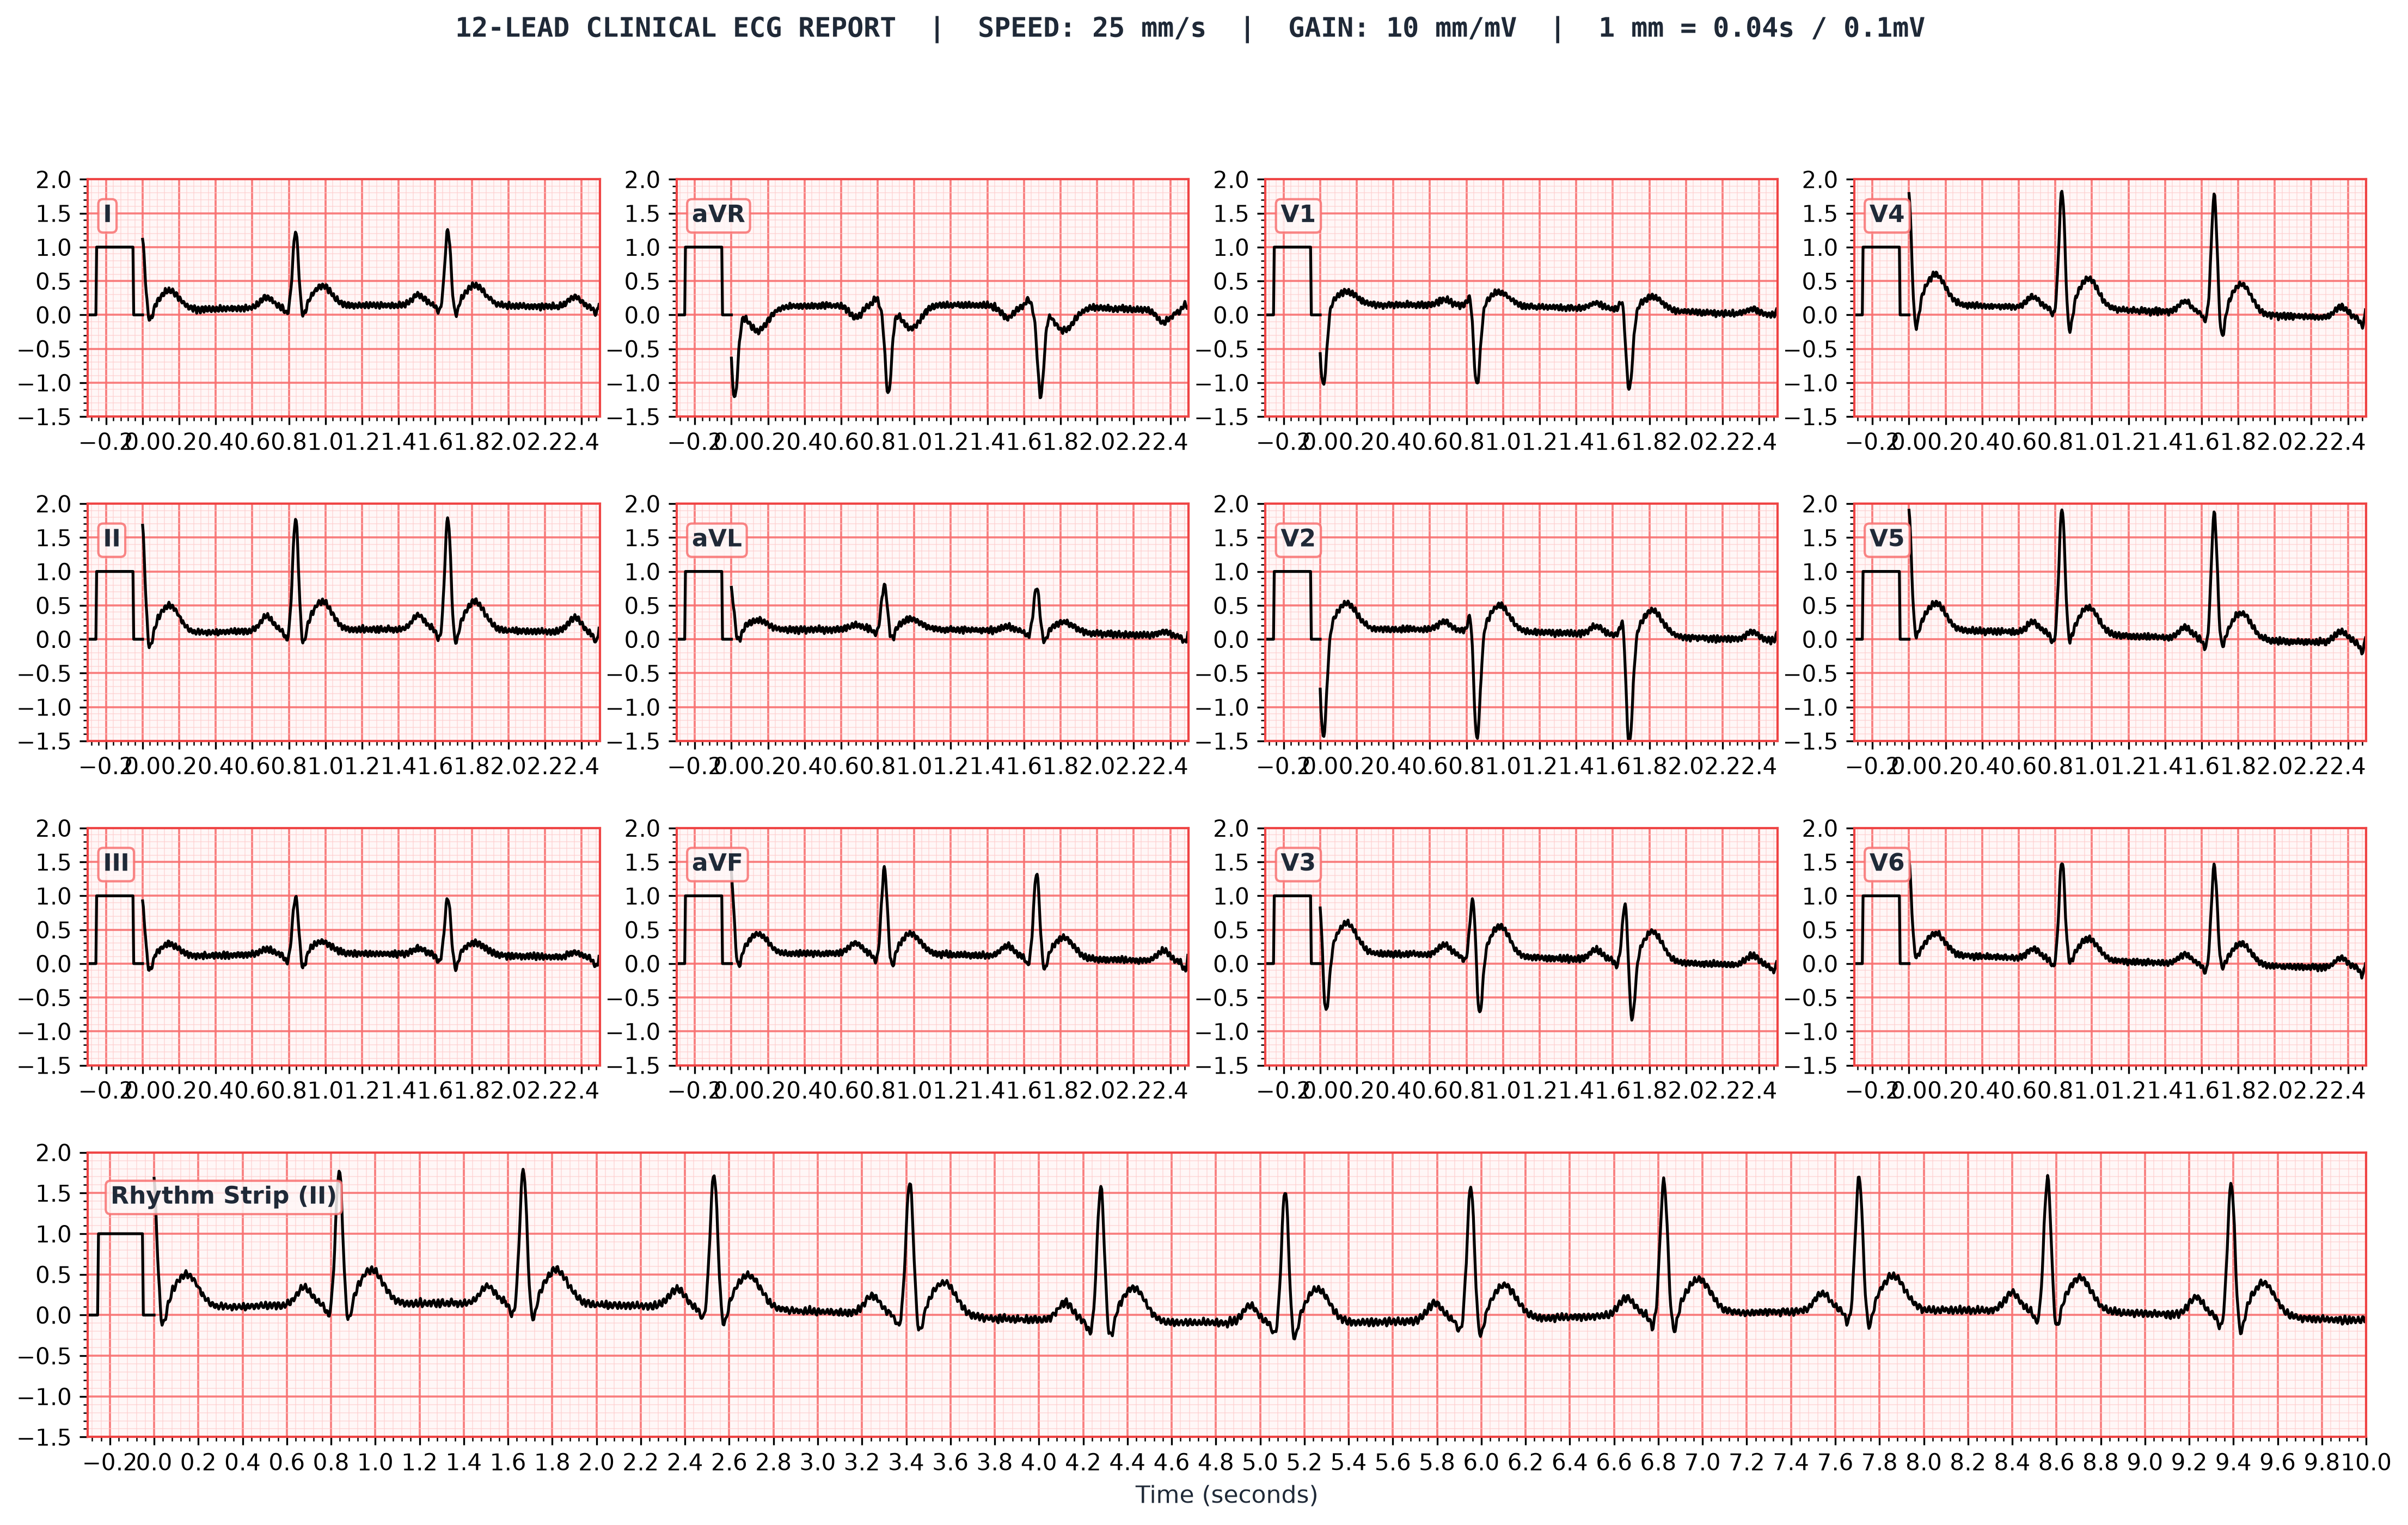
12-Lead Diagnostic ECG Report Layout (\(3 \times 4 + 1\))
The function plot_12lead_clinical() arranges the 12 leads into standard clinical quadrants:
- Row 1: Lead I, Lead aVR, Lead V1, Lead V4
- Row 2: Lead II, Lead aVL, Lead V2, Lead V5
- Row 3: Lead III, Lead aVF, Lead V3, Lead V6
- Row 4: Continuous 10-second Rhythm Strip (default Lead II).